Terrovizm update
Few years ago, I created with a fellow student an interactive visualisation of terrorist attacks across the globe.
Why the project?
The project rose from an image that I shared with a friend. The image compared the number of deaths caused by hunting, and the number of people dead in terrorist attacks. The data was restricted to France only. My friend found the image interesting, but asked a fundamental question:
Is it true?
Indeed, I had no idea. Therefore, I thought about it, looked up for accurate numbers. In the meantime, I started to follow a course about data visualization using d3.js, and decided to merge the two together. This is how everything started.
The visualization
The final project is available publicly online, known as Terrovizm, which works on mobile but is not nice to use with a small screen and a low-power device. This tool uses the database built by the Global Terrorism Database. Therefore, you may or may not agree on their definition of terrorism:
The threatened or actual use of illegal force and violence by a non-state actor to attain a political, economic, religious, or social goal through fear, coercion, or intimidation.
When building the interactive infographics, we took the database as-is, not redefining what is terrorism or not.
You can read more on the project and access the sources in the Terrovizm Github repository.
Quick preview
The visualization looks likes the following:
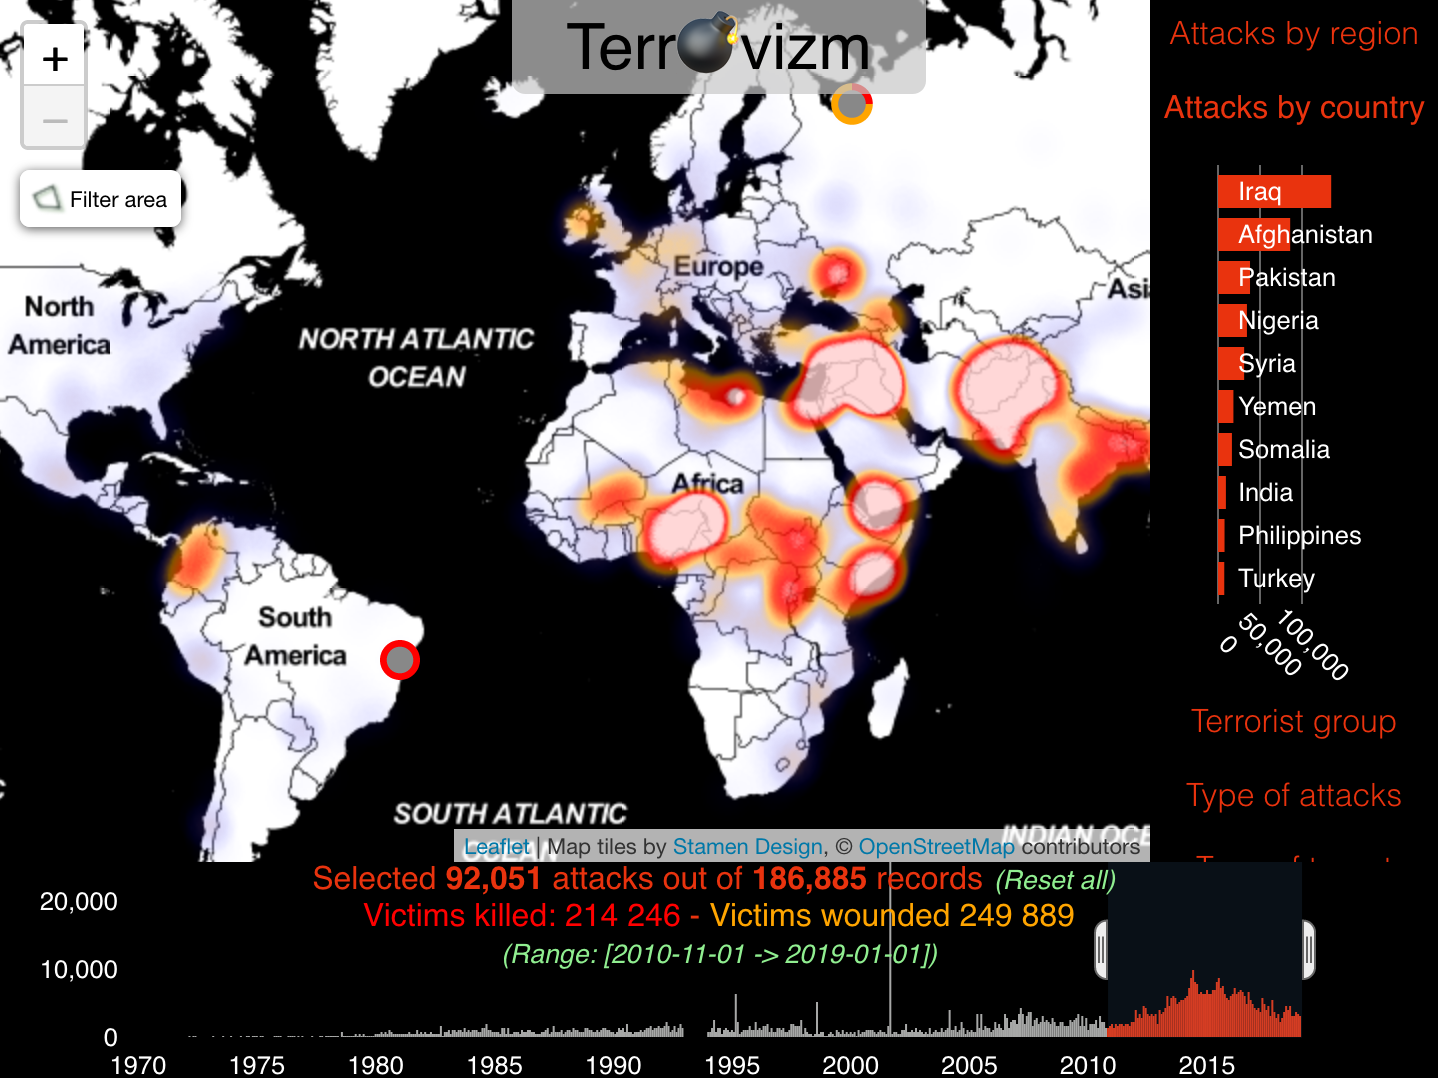
It features several useful parts and tools to explore the database:
- A map of the world, with:
- a heatmap layer showing the distribution of events. The more bright and red it is, the more events there are;
- individual markers, is there is enough space available, showing more information for each event;
- Grouping and filtering sections on the right-hand part of the screen. It is useful to understand quantitatively what happens, where, and how.
- A timeline on the bottom, to browse the database in time. It can also be used to filter data accordingly.
- Between the map and the timeline, the status of what is shown or filtered out, with a summary of the number of killed and wounded persons.
What about it now?
I recently updated the database using the version including data up to December 2018. The 2020 release, which includes year 2019, is restricted to the purchase of a commercial license.
Conclusion
Yes, in France, hunting kills more (humans) than terrorism. This is a fact, and I will not go into politics, saying that terrorism has been a very convenient motive in France to create law after law to reduce individual rights and freedoms.